 Vamimi
AI chart and table maker
Paste numbers, attach a CSV or Excel file, or describe the comparison you need. VamimiAI makes the chart, the table or the KPI tiles, and changes them when you ask.
The prompt: Chart monthly sales for this year and table the key numbers
. It goes into the message box for you to edit; nothing is sent until you press Send.
How it works
Bring the data
Paste it, attach a spreadsheet, or describe a comparison and let VamimiAI lay out the table.
Get the visual
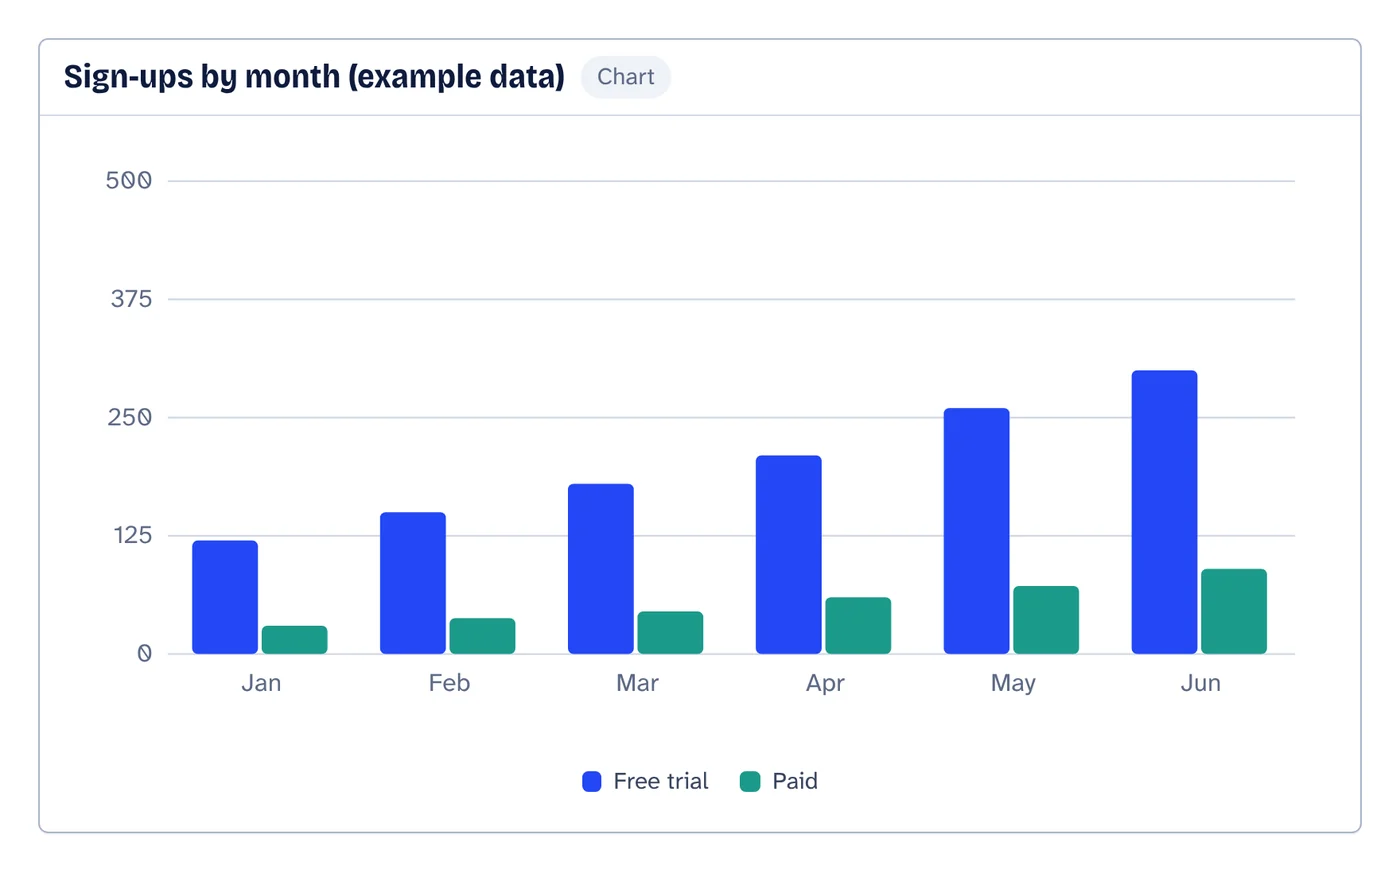
Bar, line, area, pie or donut charts, tables and KPI tiles, in one answer if you ask for several.
Change it by asking
“Make it a line chart”, “add last year”, “sort by revenue”.
What you get
Five chart types
Bar, line, area, pie and donut, with stacked bars and a unit on the values.
Tables and KPI tiles
Comparison tables with captions, and big-number tiles with change and trend.
Form editor with live preview
Edit labels, series, rows and columns by hand.
Download anywhere
SVG, PNG, JPEG or PDF for every visual. Flow diagrams also export to draw.io and Mermaid.
Saved to your account
Sign in with Google or email and your chats, diagrams and folders are there on every device. Download everything or delete your account from the app at any time.
Start from a document
Attach a policy, spec or spreadsheet and ask for the diagram. Most files are read right in your browser.
Choosing the right chart
Use a bar chart to compare categories, a line or area chart for a trend over time, and a pie or donut only for parts of one whole with a handful of slices. When exact values matter more than the shape, a table is clearer than any chart.
Spreadsheets you attach (Excel and CSV) are read in your browser. Only PDFs are sent to the server to extract their text, and nothing is stored there.
Prompts to start from
Questions
Can I make a chart from Excel or CSV?
Yes. Attach the file and ask for the chart you want. Excel and CSV files are read in your browser.
Which chart types are there?
Bar (including stacked), line, area, pie and donut, plus tables and KPI tiles.
Can I edit the numbers afterwards?
Yes. Open the form editor to change labels and values with a live preview, or ask in the chat.
Make something else
- AI timeline makerDescribe a project plan, a history or a sequence of events.
- Org chart makerTell VamimiAI who reports to whom, or attach the spreadsheet you already have, and it draws the org chart from the top down.
- AI diagram generatorDescribe a process, a system or an idea in a sentence.
- Turn a document into a flowchartPolicies, procedures and specs describe processes in long paragraphs.
Part of Diagram makers: Every kind of visual VamimiAI makes from a description: flowcharts, sequence, architecture and swimlane diagrams, mind maps, org charts, charts and timelines.
Describe it. Get the diagram.
No account needed. Write what you want, or attach a document, and refine the result by asking.
Open VamimiAI