 Vamimi
Org chart maker
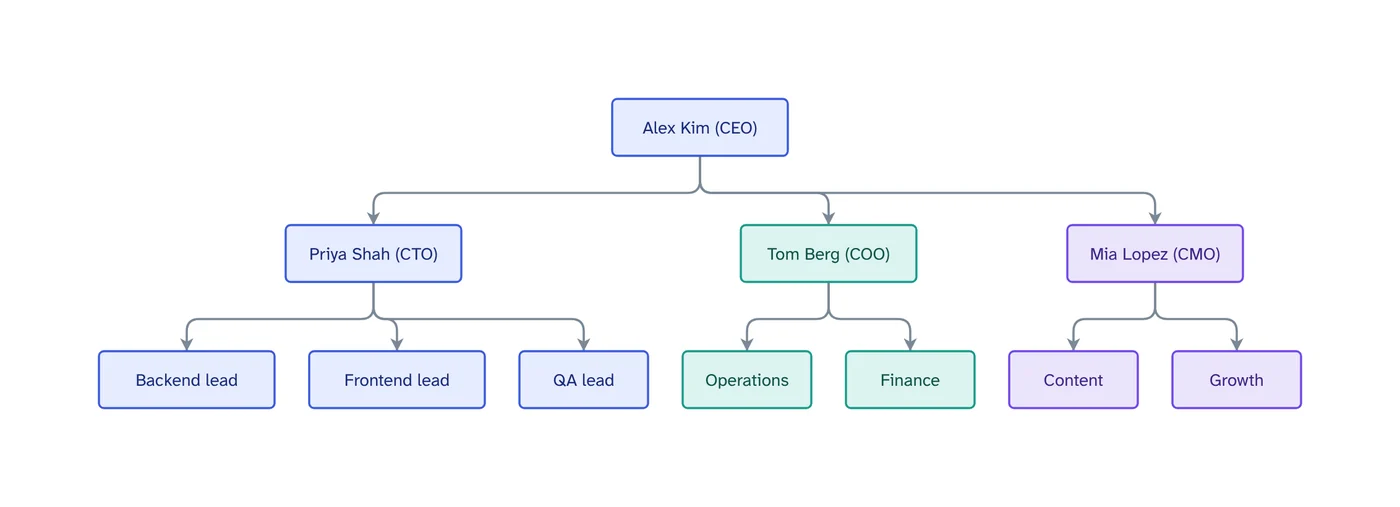
Tell VamimiAI who reports to whom, or attach the spreadsheet you already have, and it draws the org chart from the top down.
The prompt: Make an org chart for a 15-person startup with engineering, operations and marketing
. It goes into the message box for you to edit; nothing is sent until you press Send.
How it works
List the people
Names and roles in any form: a list, a paragraph or an attached spreadsheet.
Get the chart
The hierarchy is drawn top to bottom, and wide teams are stacked so the chart does not run off the page.
Keep it current
“Move Sam under Priya”, “add two backend engineers”. The rest of the chart stays where it was.
What you get
Stacks large teams
A manager with many reports gets them in tidy columns instead of one endless row.
Names and roles
Each box can hold a name and a role, and boxes are sized to fit the text.
Edit by hand too
Drag, resize, connect, add shapes, type labels, undo and redo. Your next message continues from your version.
Download anywhere
SVG, PNG, JPEG or PDF for every visual. Flow diagrams also export to draw.io and Mermaid.
Saved to your account
Sign in with Google or email and your chats, diagrams and folders are there on every device. Download everything or delete your account from the app at any time.
Start from a document
Attach a policy, spec or spreadsheet and ask for the diagram. Most files are read right in your browser.
Tips for a clear org chart
Put the role in the label, like “Priya Shah (CTO)”, so the chart still makes sense to someone who does not know the names.
For a large company, make one chart for the leadership team and a separate chart per department. Each stays readable and is easier to keep up to date.
Prompts to start from
Questions
Can I make an org chart from Excel?
Yes. Attach the spreadsheet (Excel or CSV) and ask for an org chart. It is read in your browser.
Does it handle big teams?
Yes. Wide teams are stacked in columns. A single diagram holds up to 60 boxes; split larger organisations into one chart per department.
Can I change the chart later?
Yes. Ask in the chat or edit it by hand. Your chats are saved in your browser.
Guides on this
Make something else
- AI mind map makerGive VamimiAI a topic, a plan or your notes, and it draws a mind map: the topic in the middle, main branches around it, each branch in its own colour.
- AI diagram generatorDescribe a process, a system or an idea in a sentence.
- Swimlane diagram makerWhen a process passes between people or teams, a swimlane diagram shows who does each step.
- AI chart and table makerPaste numbers, attach a CSV or Excel file, or describe the comparison you need.
Part of Diagram makers: Every kind of visual VamimiAI makes from a description: flowcharts, sequence, architecture and swimlane diagrams, mind maps, org charts, charts and timelines.
Describe it. Get the diagram.
No account needed. Write what you want, or attach a document, and refine the result by asking.
Open VamimiAI